

A student sosciety - lead project based at the University of Edinburgh focusing on the development of Hyperloop.
Click me to learn more!
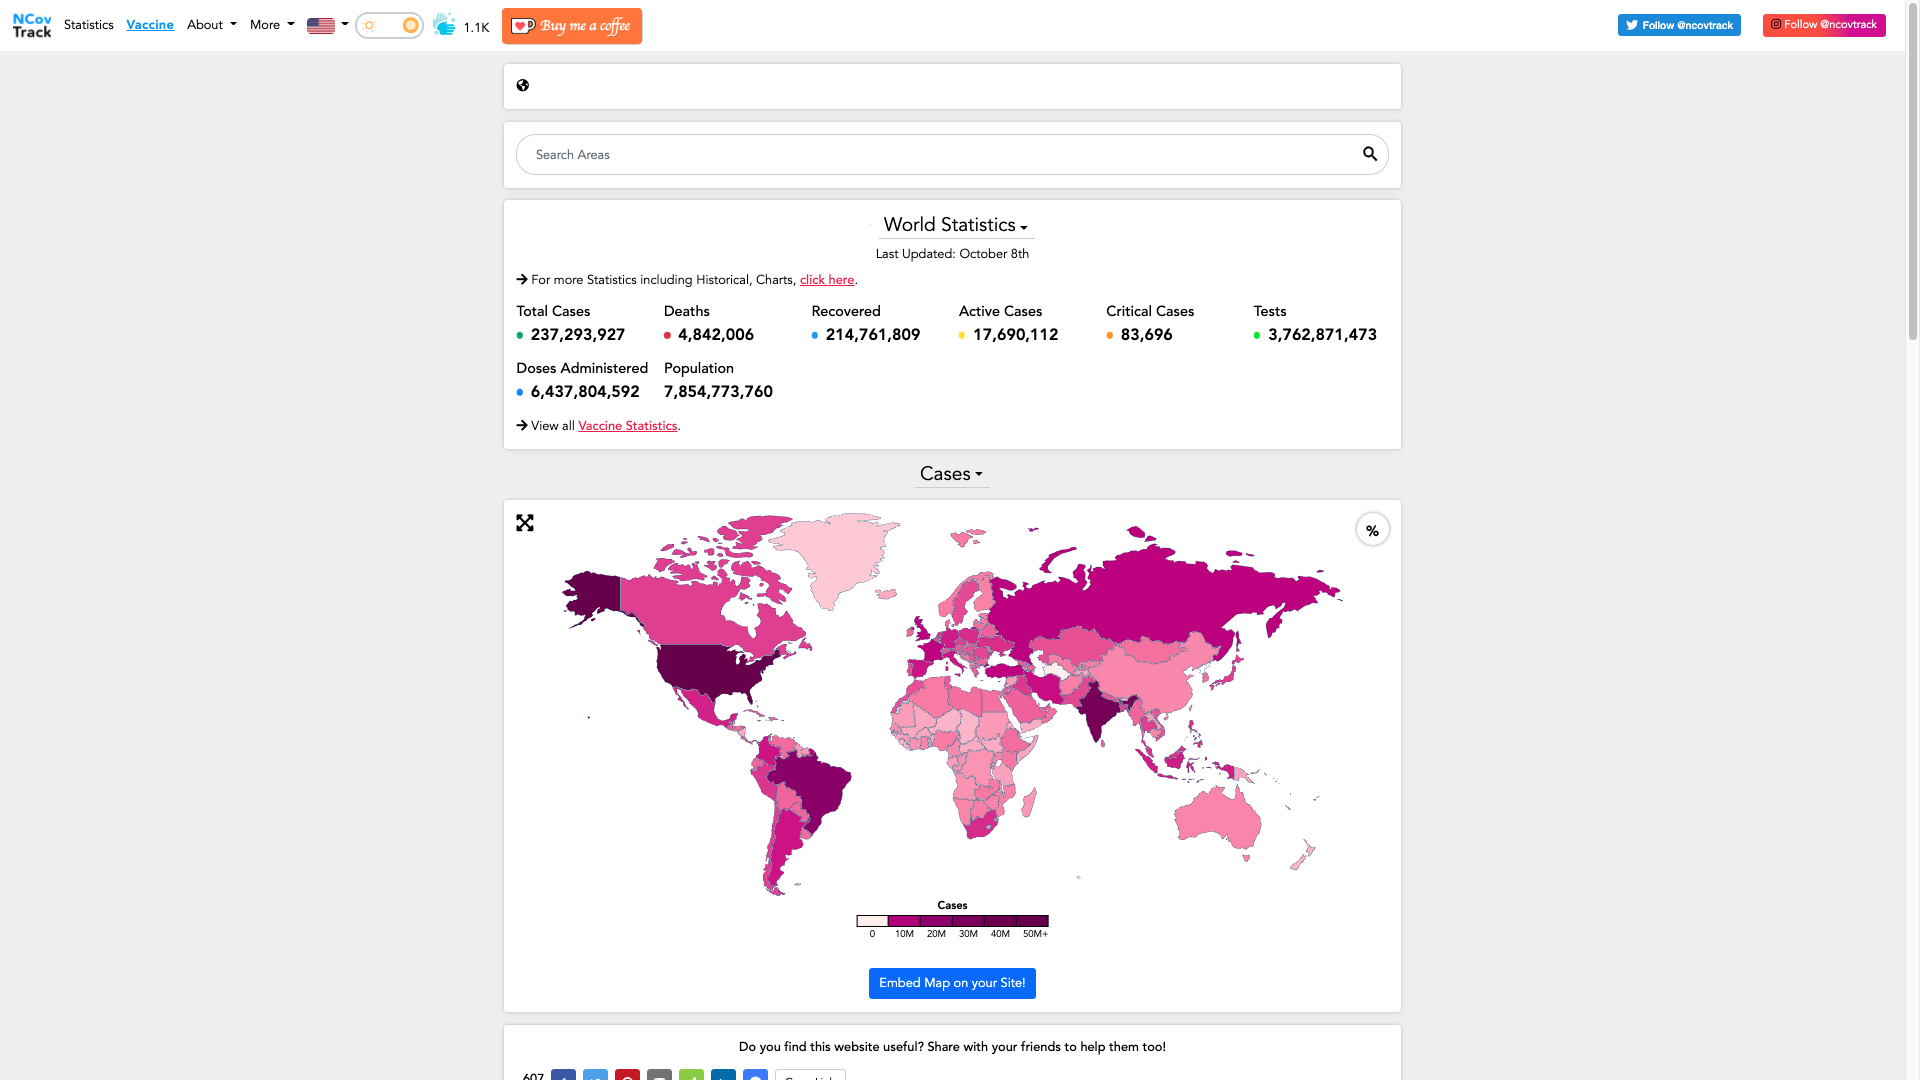
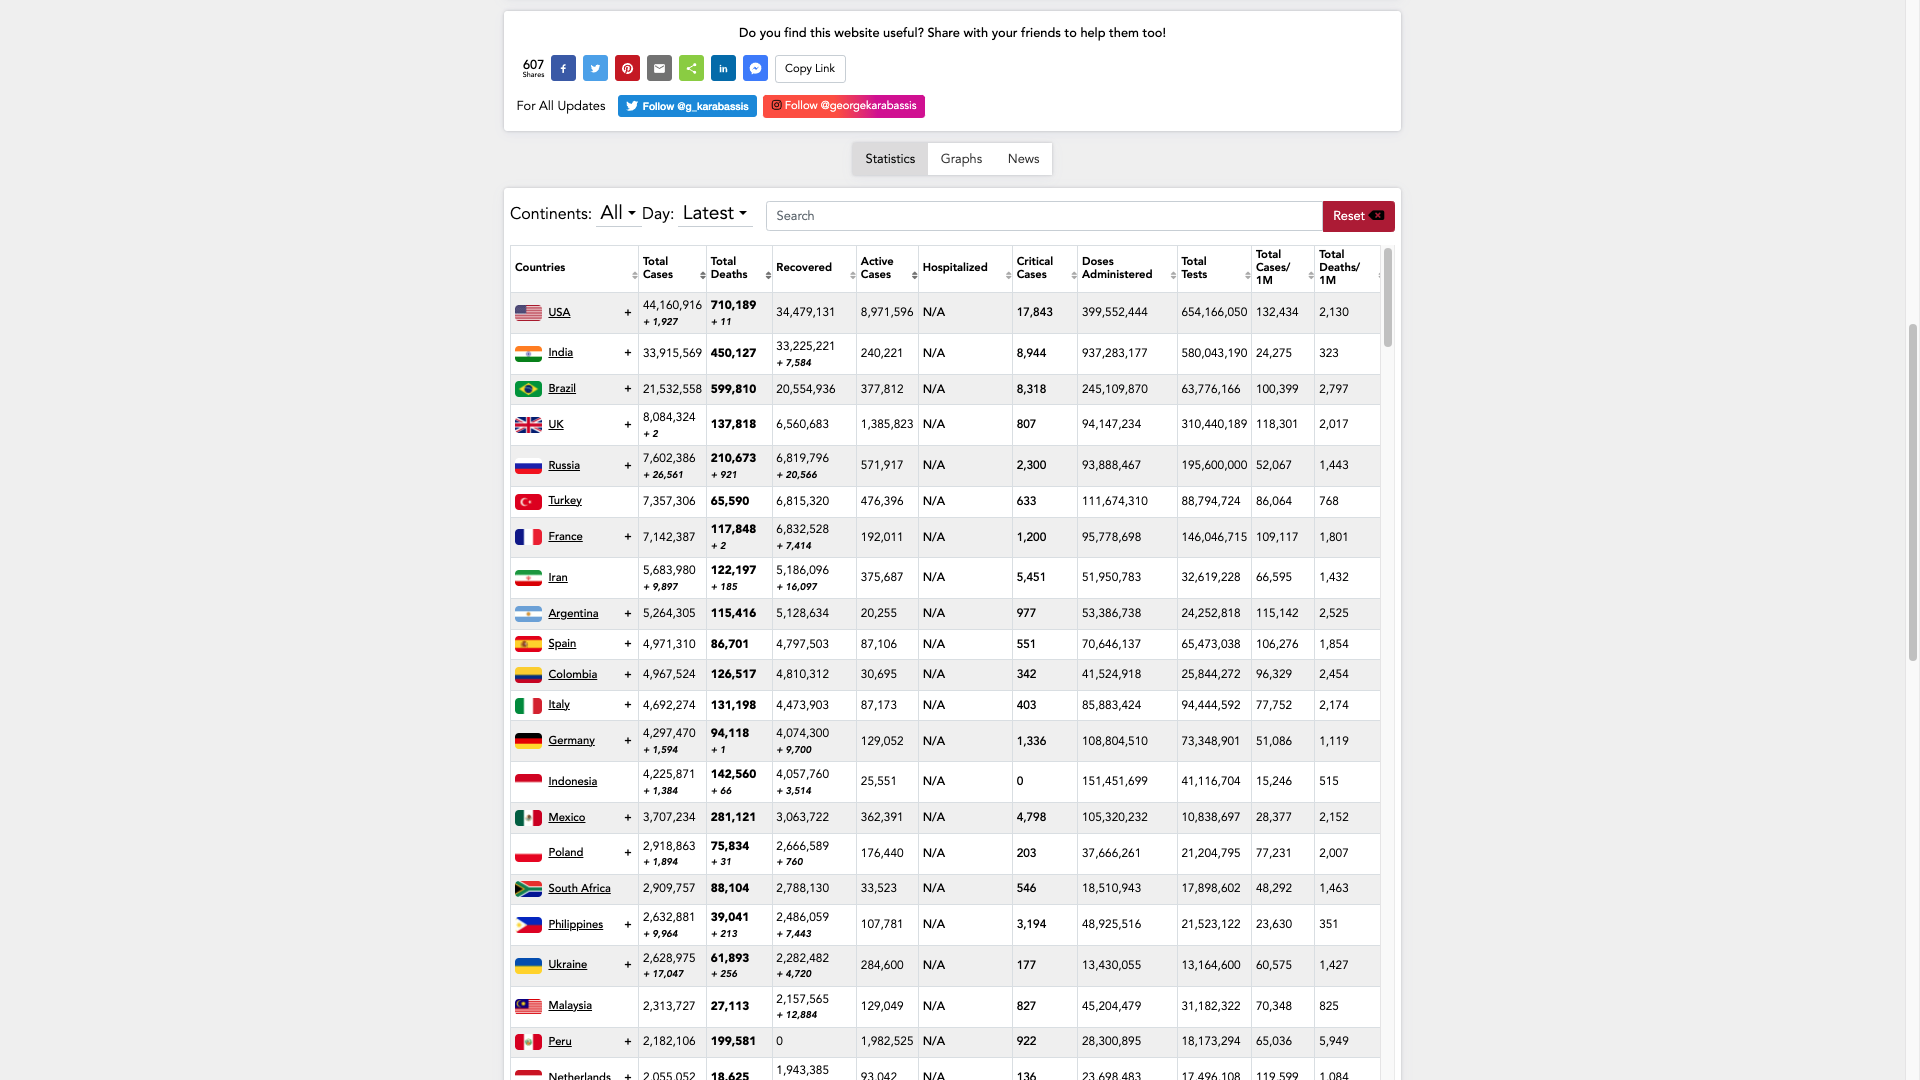
I found it very difficult to find detailed coronavirus information per area.
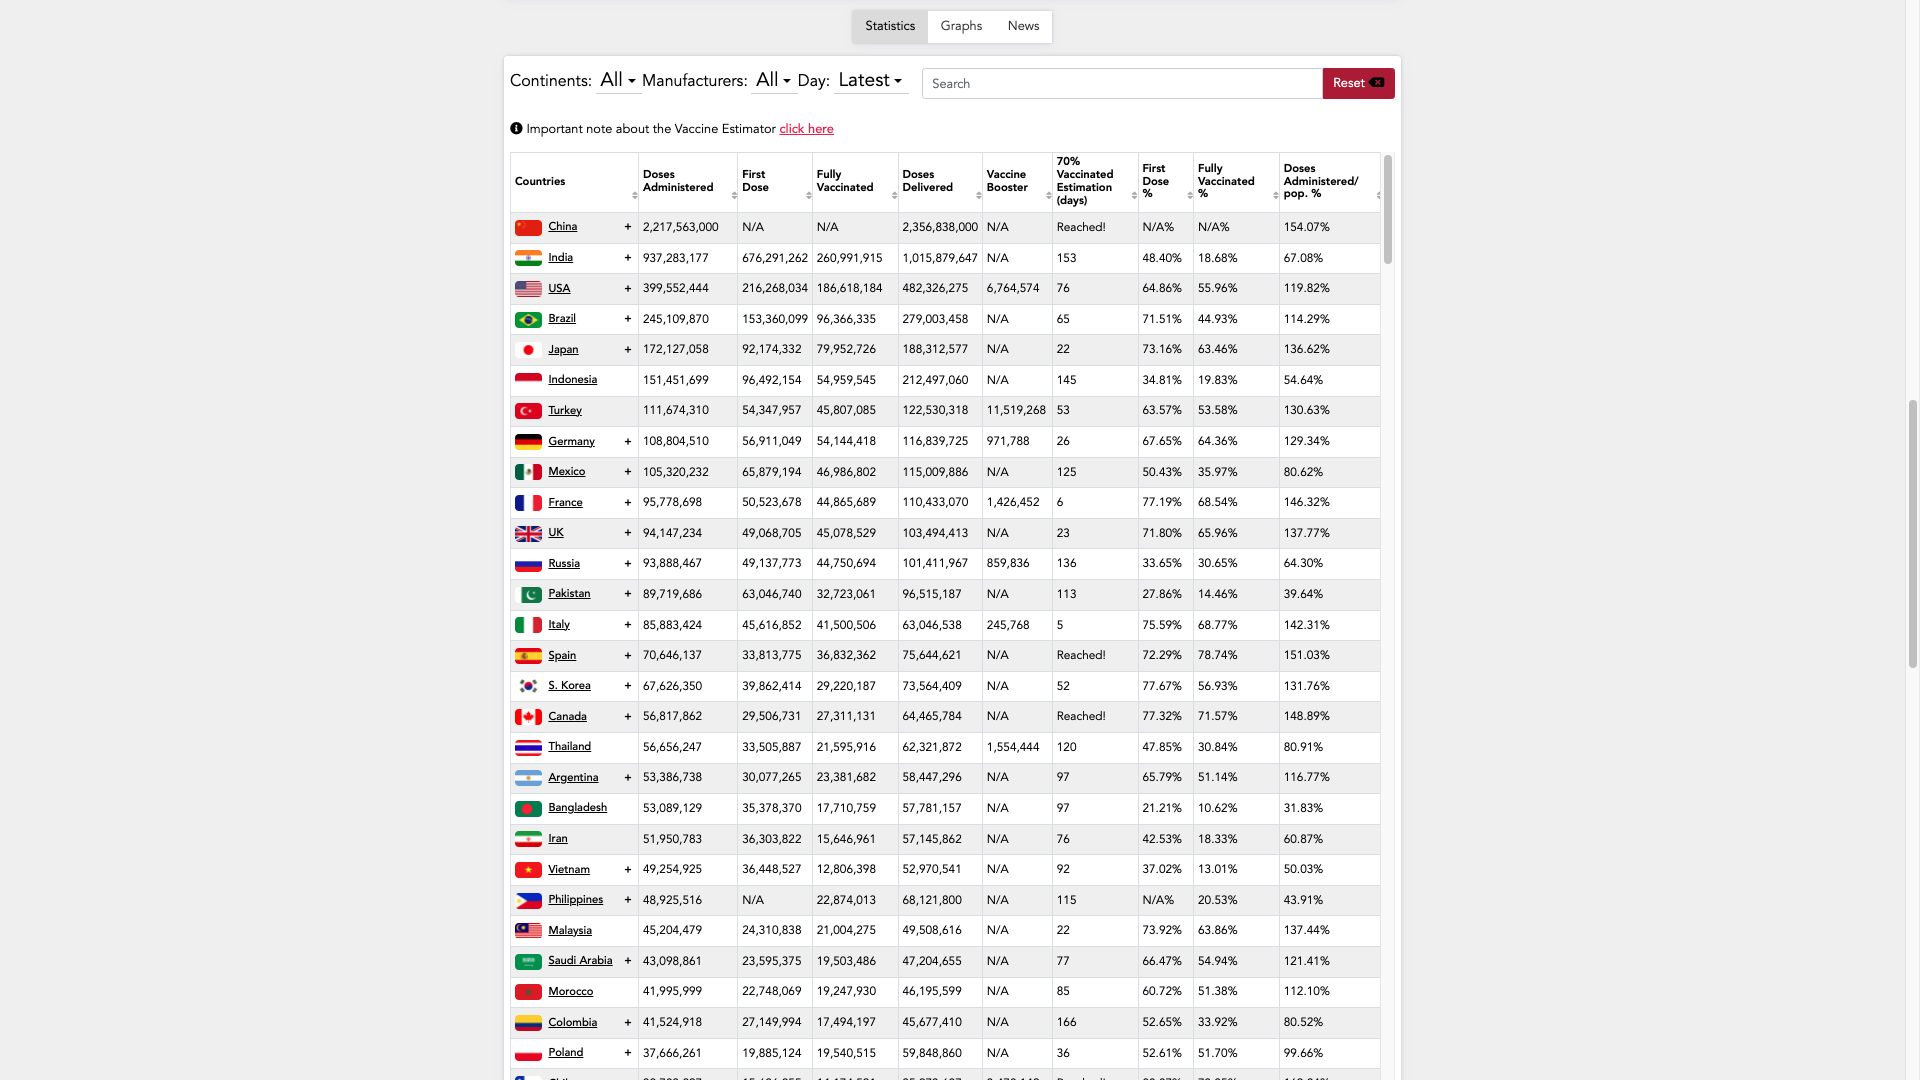
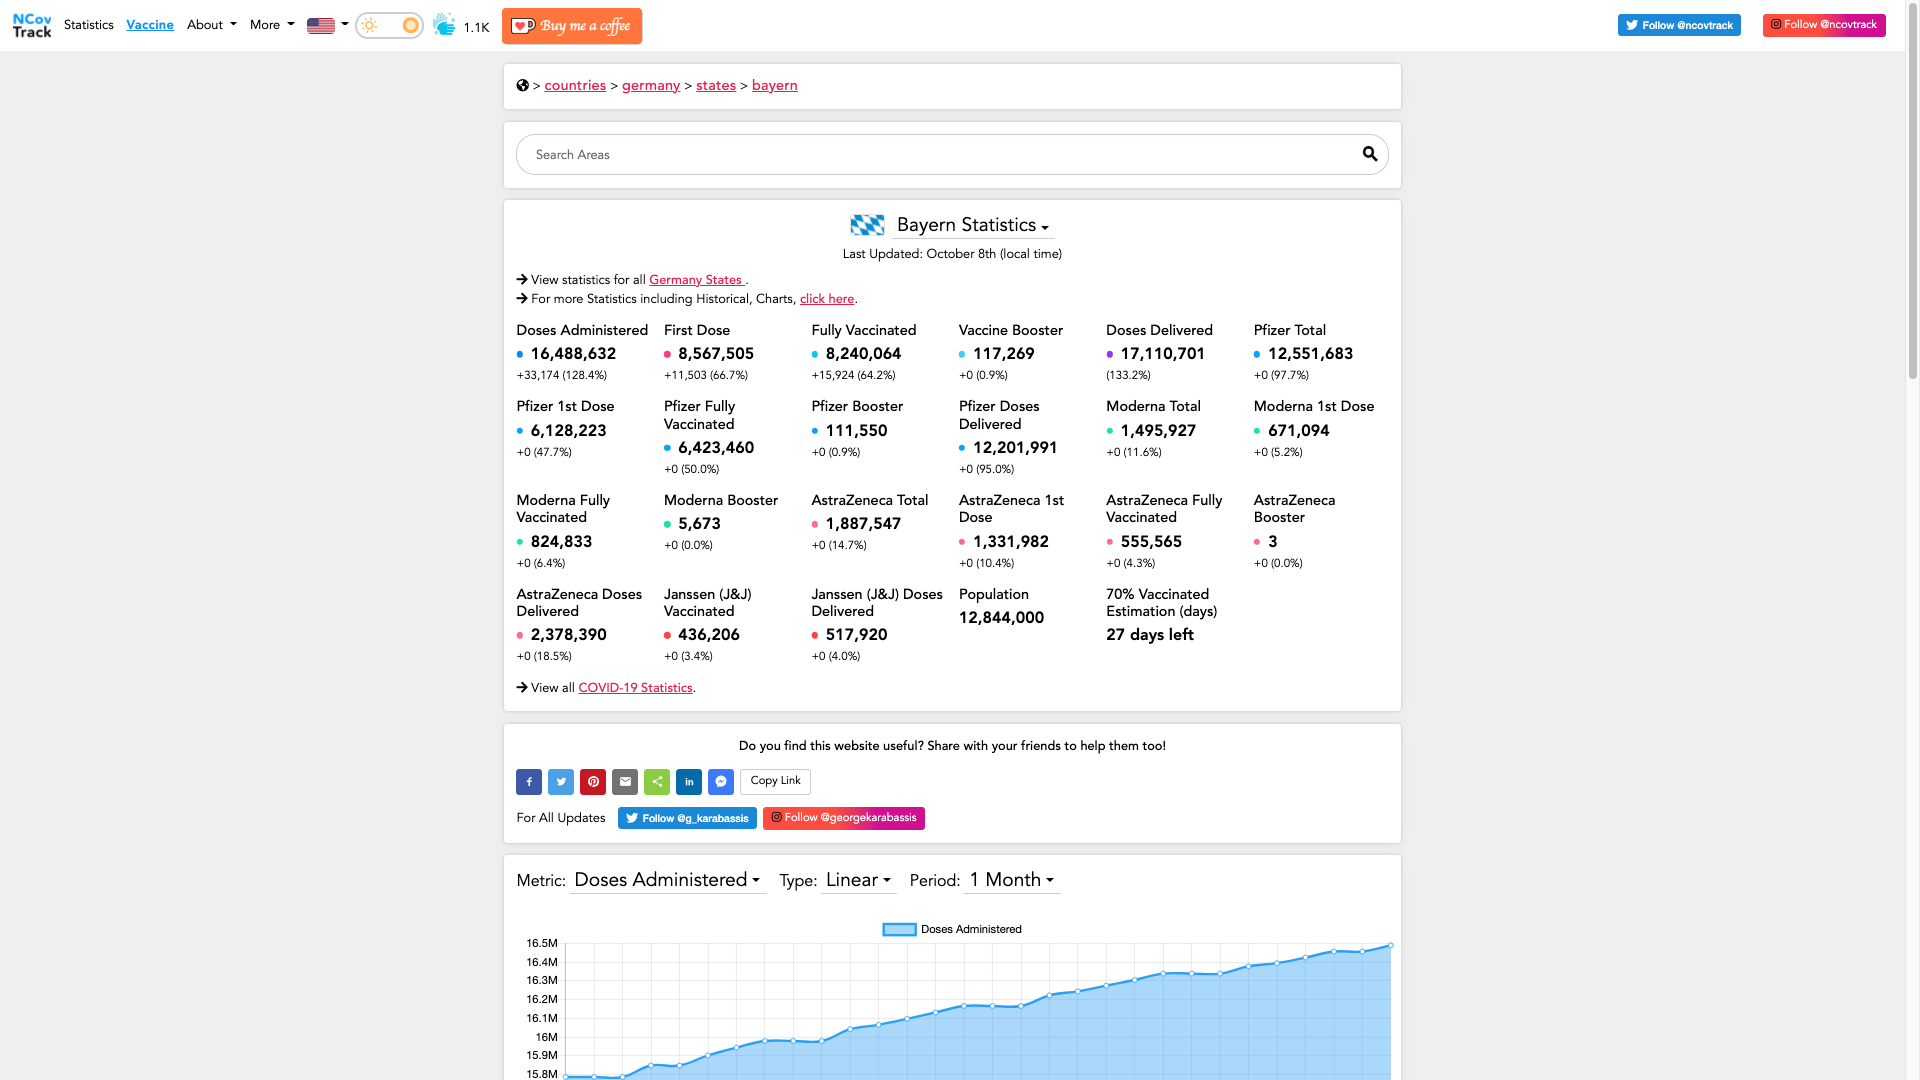
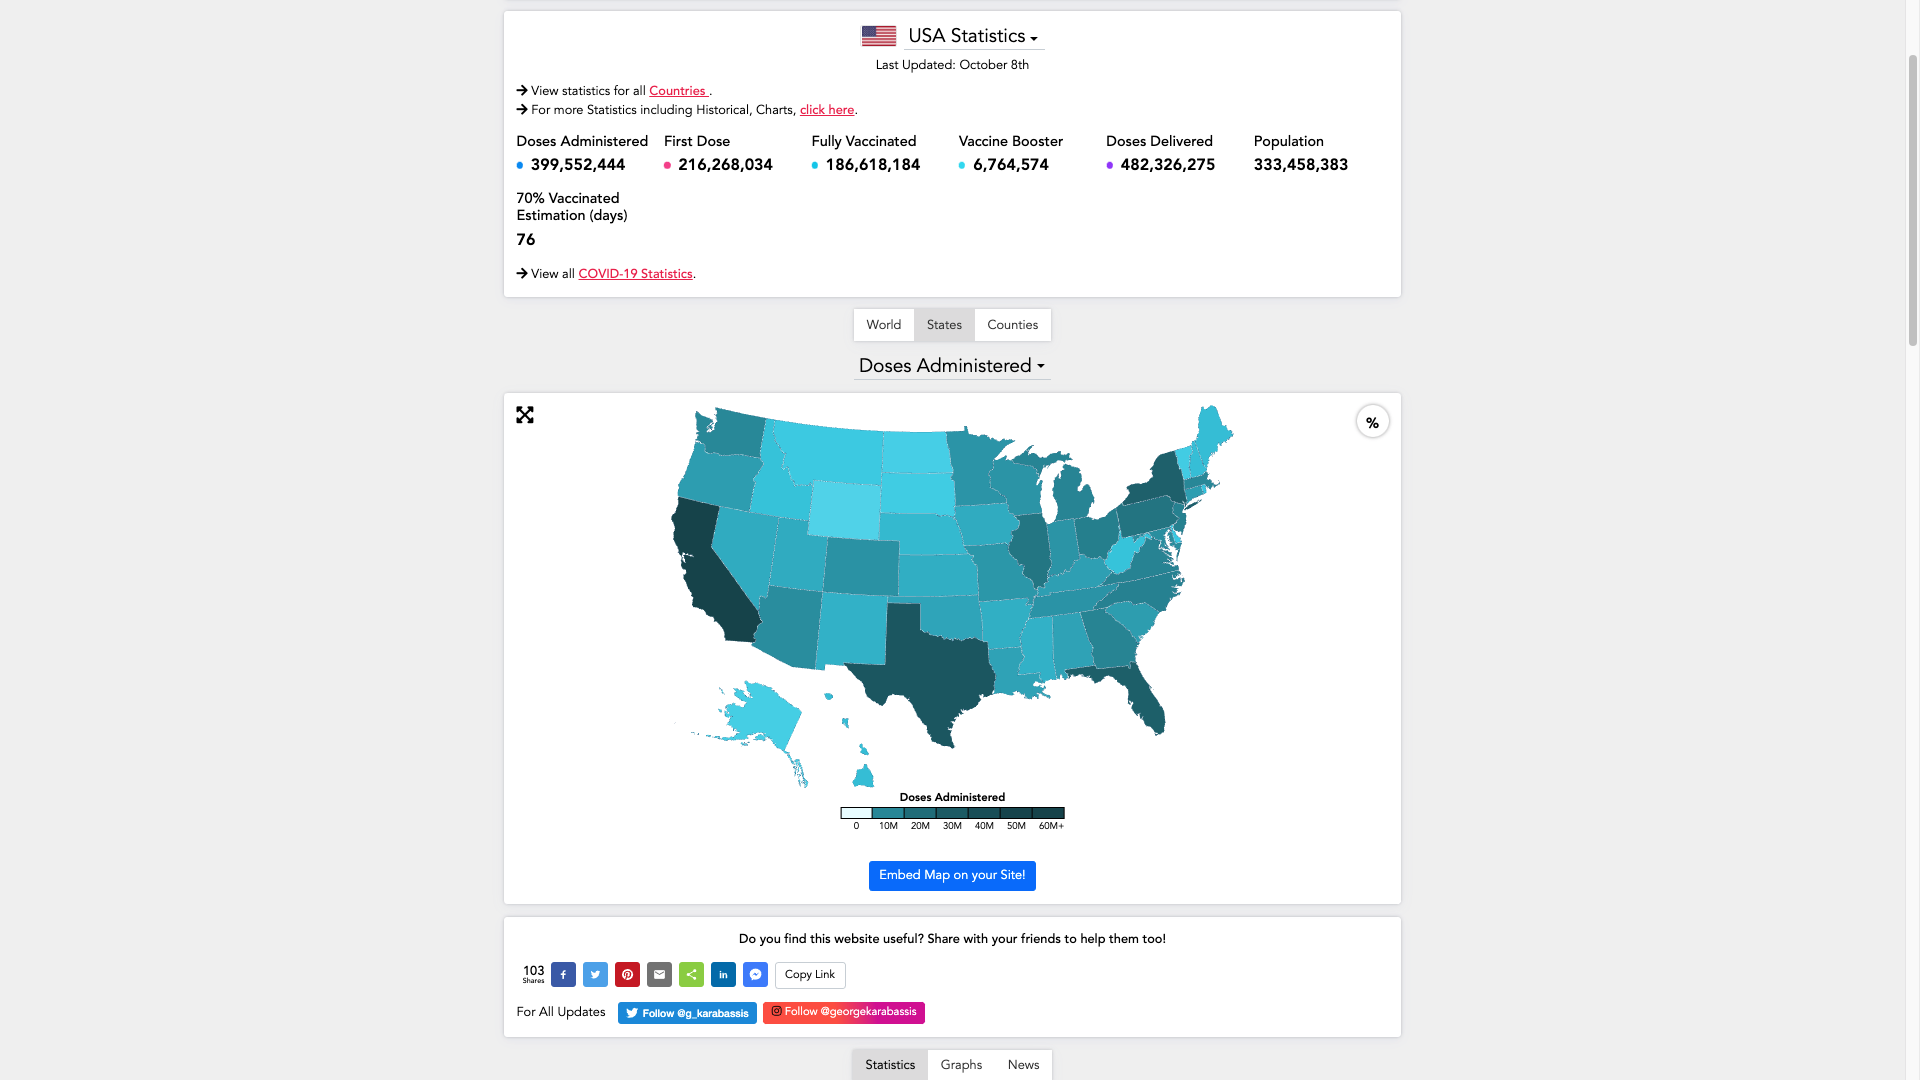
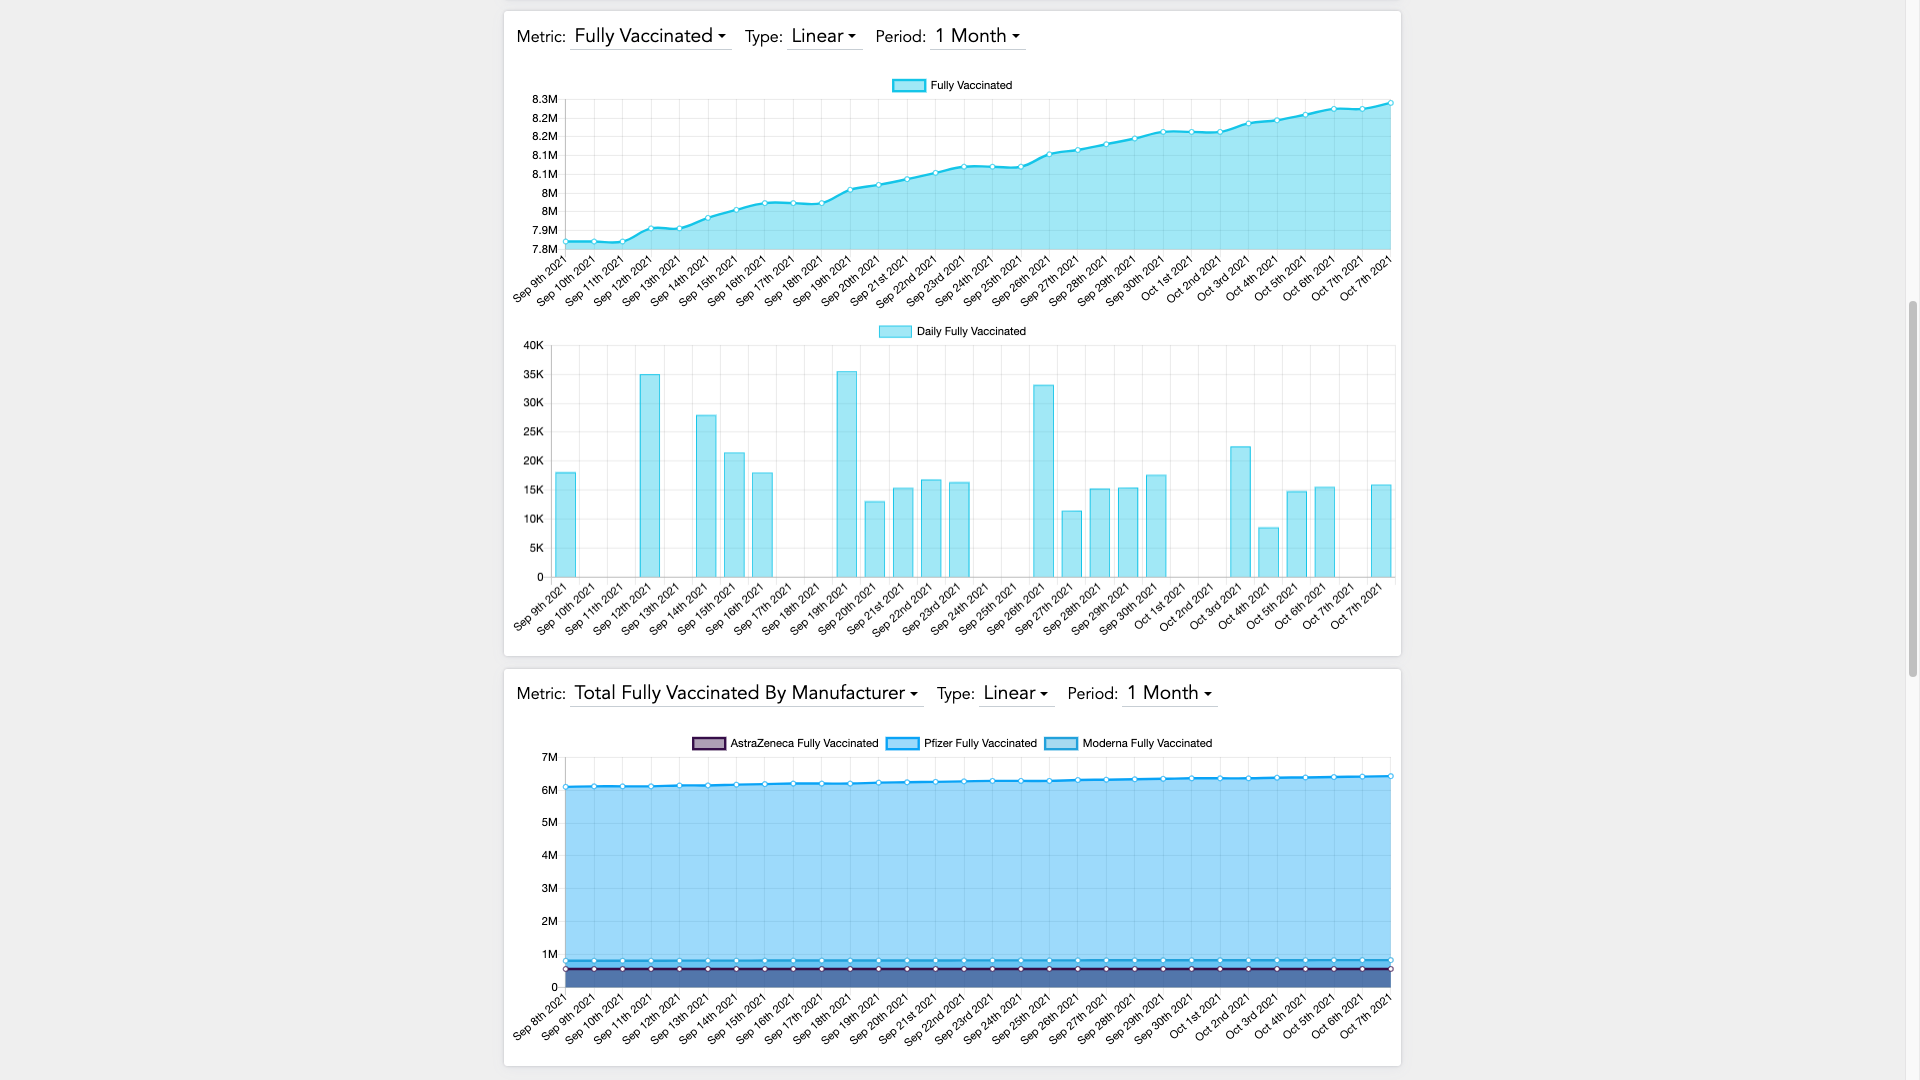
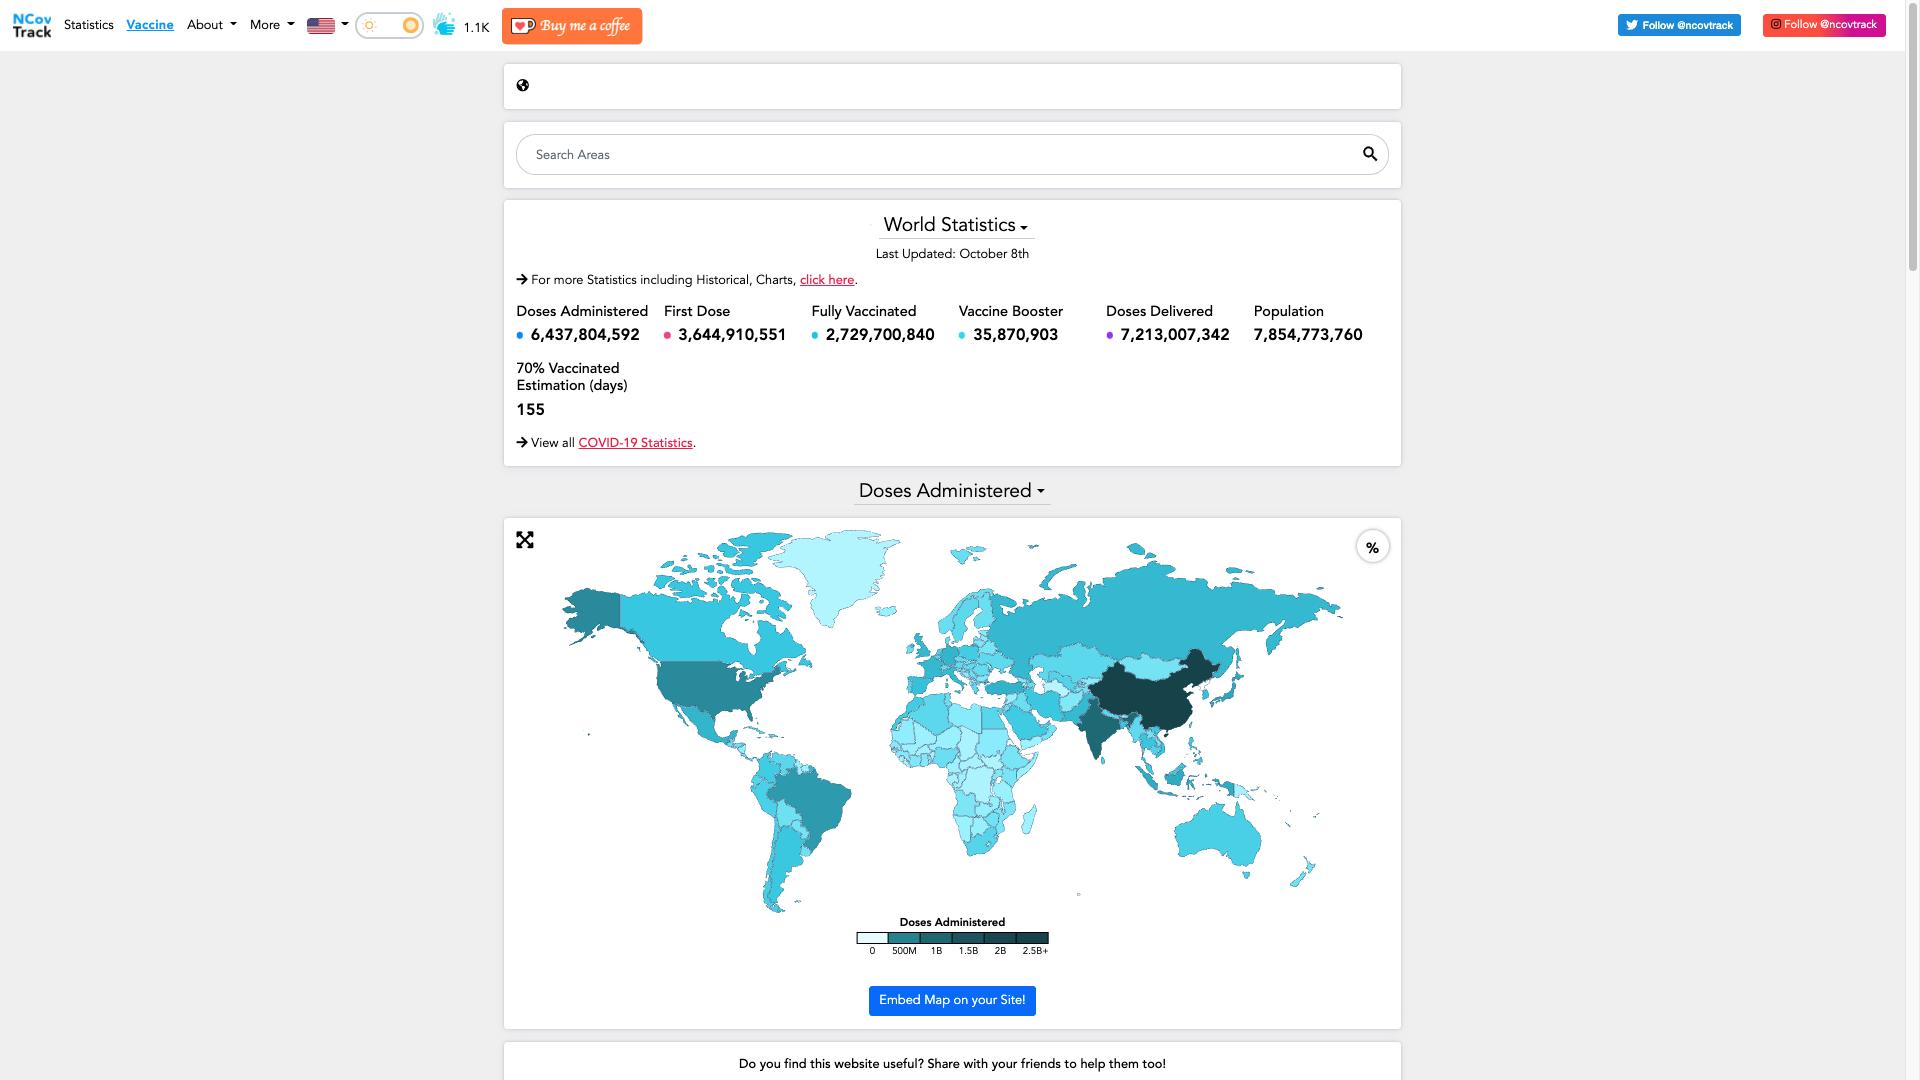
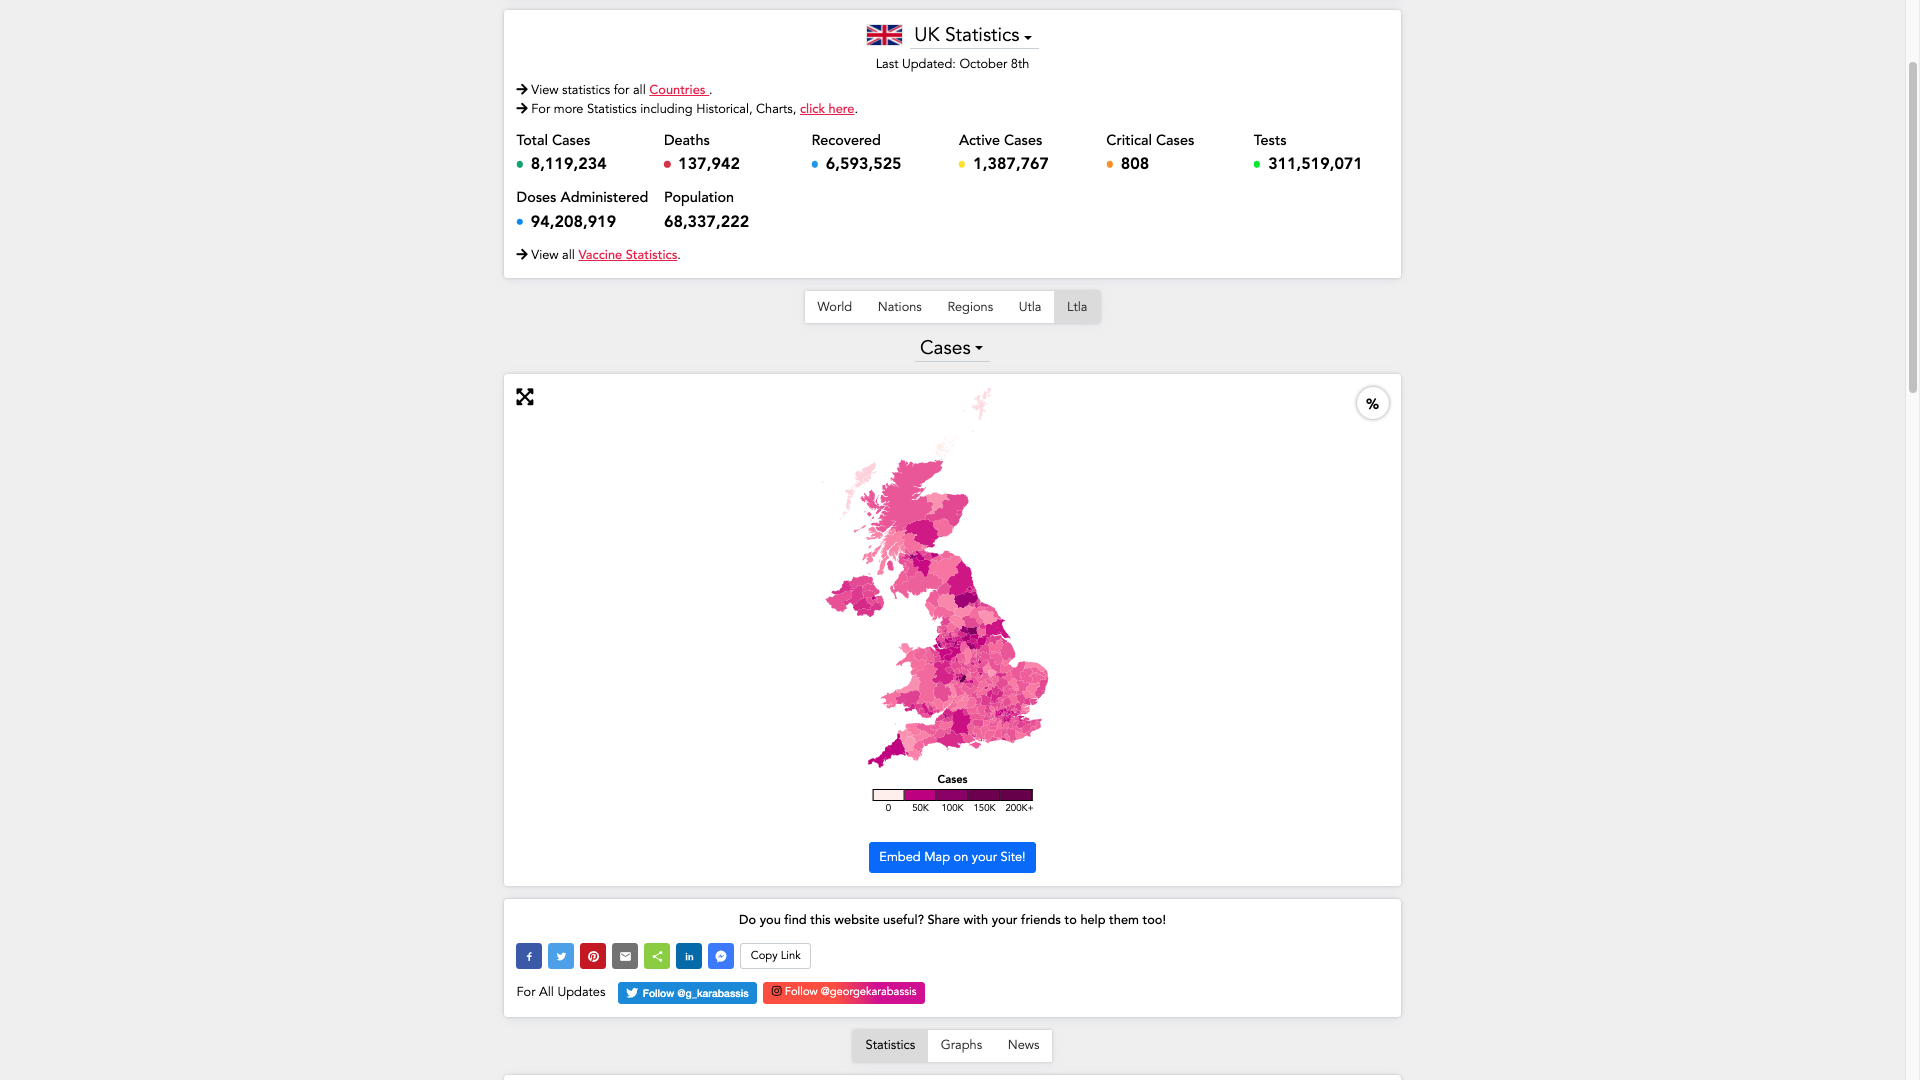
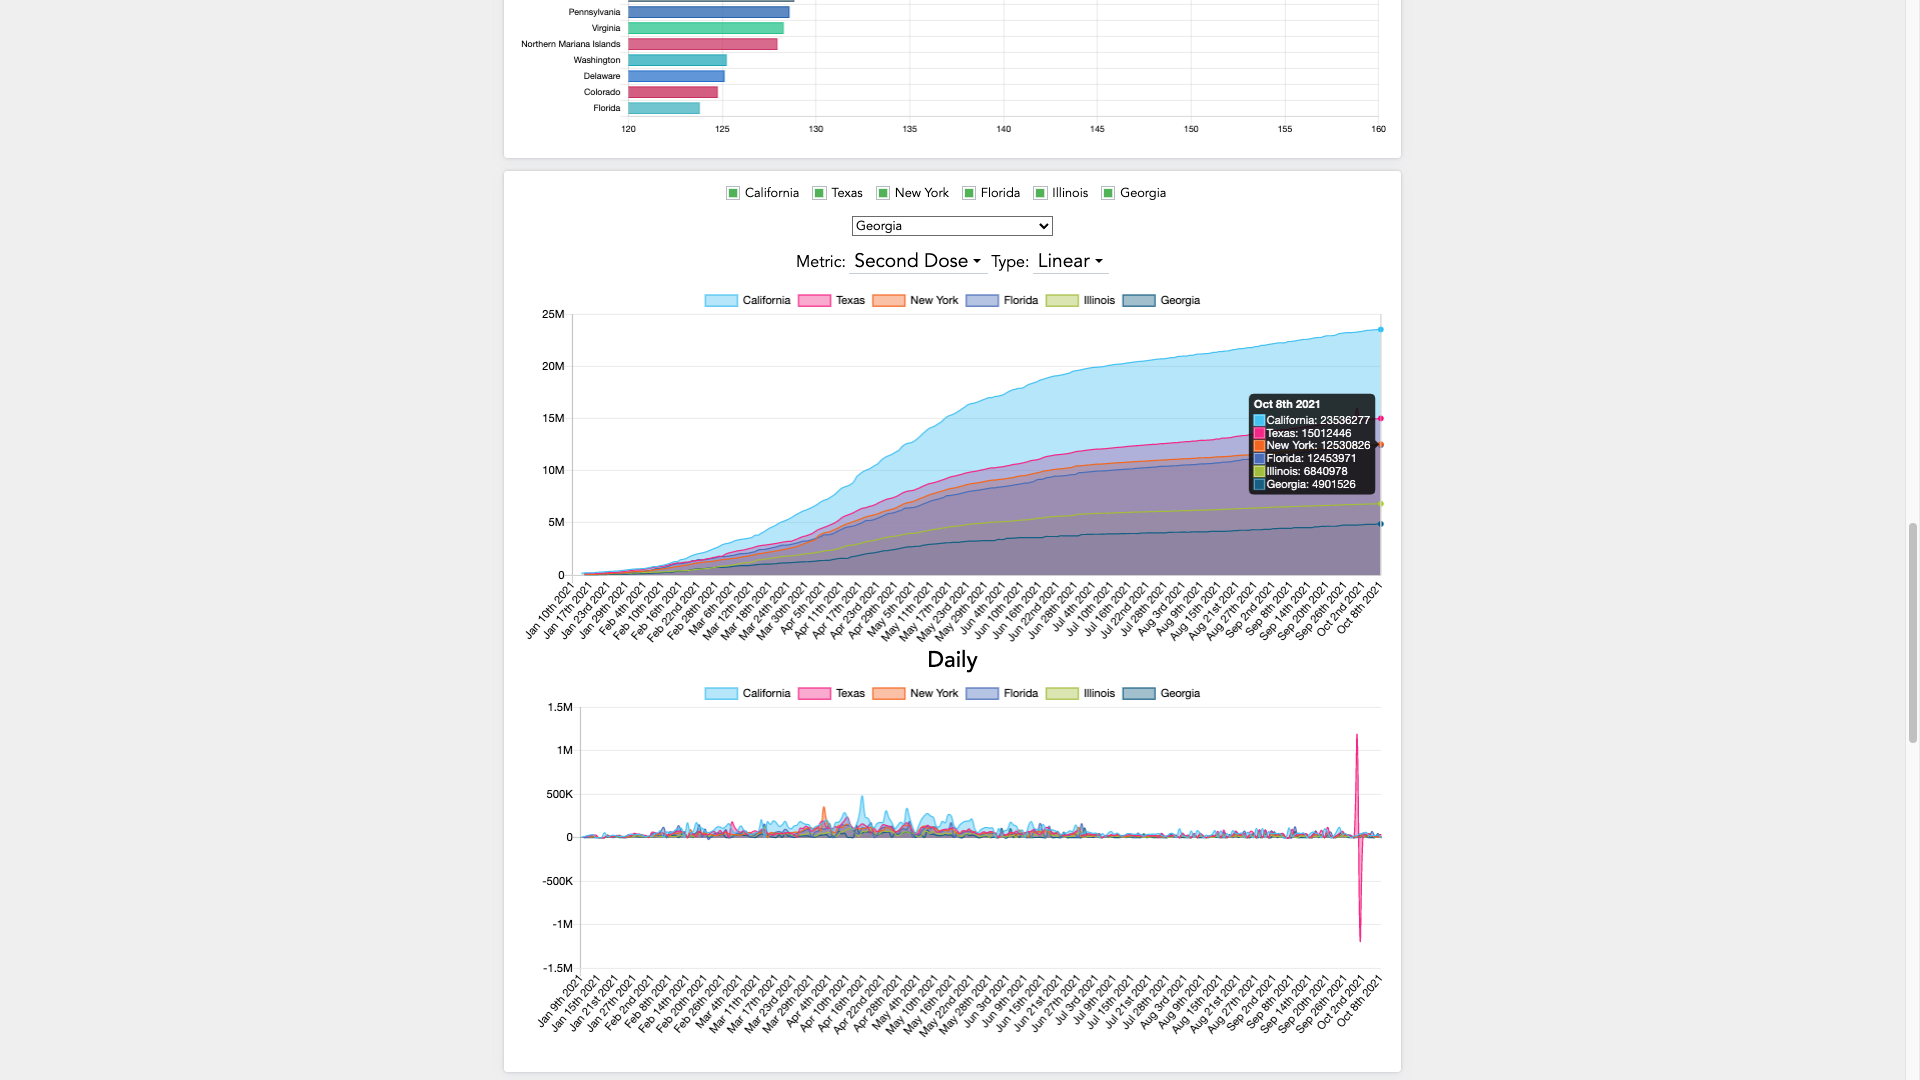
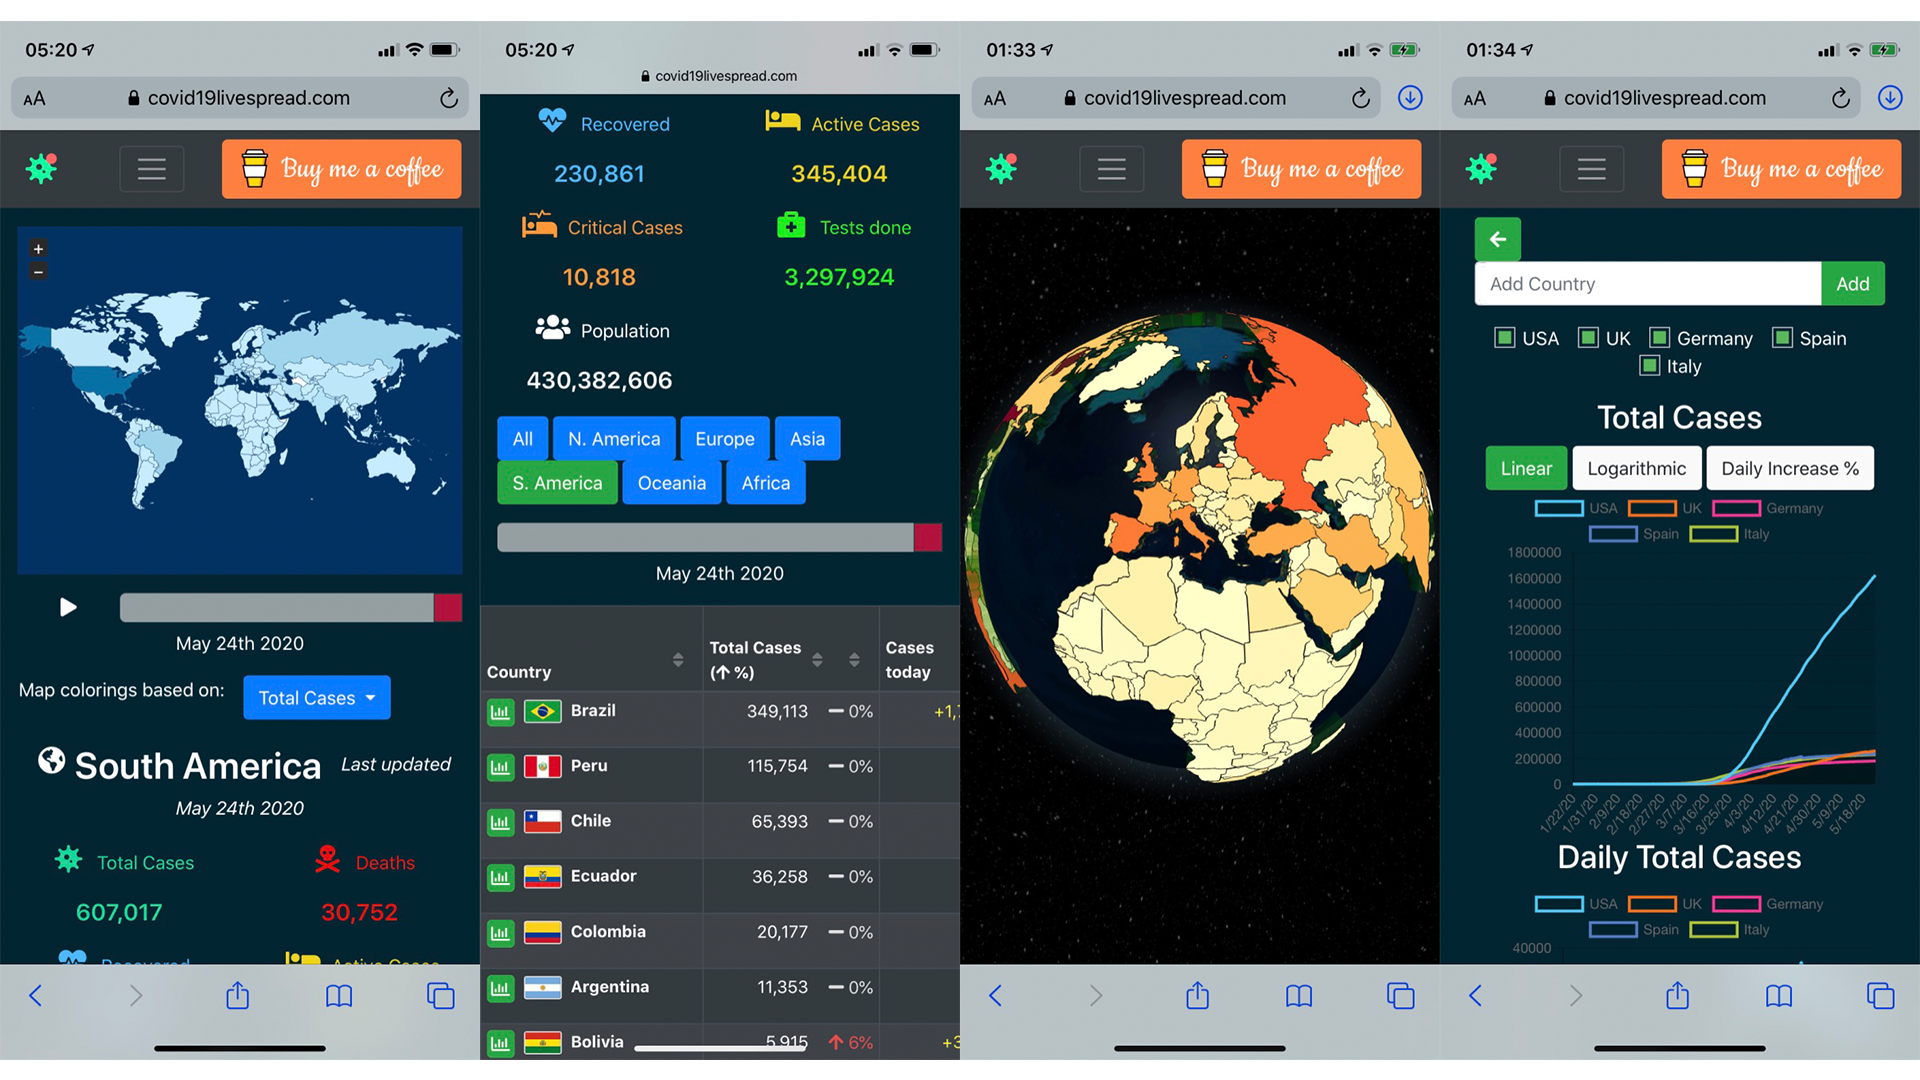
The NCovTrack website aimed to become the most detailed vaccine and COVID-19 Dashboard by providing detailed statistics of these statistics in provisional and county-wise level by country around the world by automatically fetching the data from governmental and health department bodies of each country. Since the beginning of the development, the website underwent multiple re-innovations including code refactoring, improving the UX & UI design, and adding more data. Since the website became live on the 24th of May 2020 under the name of Covid19LiveSpread, the website received over 30M total visits!
The idea of creating NCovTrack came from the beginning of the pandemic when my grandparents were unaware of how the coronavirus is expanding in my home country, Greece. The statistics would be scattered on the web and were difficult to find, as well as they were not up to date at that time. At the same time, data from each sub-region (council) of Scotland was also not widely available. This gave me the opportunity to create a new website where everyone would be able to visit and find the exact data they are looking for from their local area.
So, I started developing the website on the 6th of May 2020. While working on it, I had 0 experience with using modern front-end and back-end technologies such as node.js, express.js, and MongoDB, but given the unlimited resources the web has nowadays, I was able to learn everything I needed to create the website from scratch. After pulling entire days of work with some sleepless nights, I finished the website within 3 weeks. People in my network gave me support for the website and the department of the School of Informatics of the University of Edinburgh featured the project.
After a long time working on this project, not only I expanded my technical knowledge, but also, I learned how important planning is. This is my first time undertaking a project of such a scale and despite making many costly mistakes, I was determined to keep improving the website based on each visitor's feedback. The website started receiving a high influx of visitors in January 2021 after posting it on a few Facebook groups regarding the vaccination statistics, and due to the high demand, I kept improving the design and adding more data to serve a broader audience from more countries outside the USA, UK, and Greece. Thanks to the diverse population and to my volunteers, the website is translated into 21 different languages.
The website has been featured in top newspapers in Greece, including in.gr, as well as speaking to multiple Greek TV channels about the project, as well as in Texas. Interviews have been uploaded to my personal YouTube channel. The website was even used briefly by a News Media company for reporting the vaccination statistics in California.
The website was created using node.js and express.js, together with some Python for backend and vanilla JavaScript in the front-end. As I am currently learning React.js, I am planning on converting the entire front-end system into React as part of my learning process.